Urban Drainage and Flood Control District

E-19 Survey

Orodell Gage
ALERT ID: 4403
LID: ODBC2
HDR Engineering, Inc.
303 E 17th Ave. Suite 300
Denver CO, 80203
Introduction
HDR
Engineering Inc. was contracted by the Urban Drainage and Flood Control District to survey
various flood warning stage gages to provide information about these site in a manner
consistent with National Weather Service E-19 procedures.
On October 12, 1999, five sites were surveyed by HDR personnel in the Boulder Creek
and South Boulder Creek basins. This report
is a summary of the work done and information gathered for the Orodell gage. Included in this report are elevations of critical
points in the vicinity of the site, estimates of stages causing flood damage in vicinity
of the gage, and where available past history of the sites including historic high water
marks and other critical flood information.
Site
The
stream gage is located on Boulder Creek just upstream of Orodell along Highway 119 near
mile marker 38, just downstream of the Boulder hydroelectric plant. The ALERT ID number for this Gage is 4403 while
the National Weather Service LID is ODBC2 and is referred to as Orodell. The Gage and has been a USGS Gage since 1887 and
recently added an ALERT transmitter to the site for inclusion into the District’s
ALERT system. There is one large structure
just to the northwest of the Gage along with an access road and a few small picnic tables. Potential flooding at this gage site itself would
be minor consisting of over topping the bikepaths along the stream and possible inundation
of Highway 119 at very high stages. The
primary area of flooding potential is in the City of Boulder approximately three miles
downstream. Figure 1 shows a general location
map of the site.
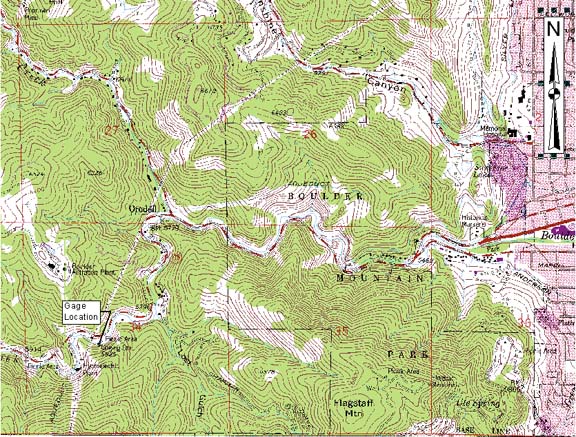
Figure
– 1 Location Map
Surveyed
locations
The
ground elevations along the left overbank were surveyed for a potential cross-section in
conjunction with previous rating studies of the gage.
In addition the foundation corners of the large building to the northwest of the
gage were surveyed, along with water surface elevations of the stream upstream and
downstream to estimate the channel slope and this reach.
Figure 2 shows locations of the surveyed points in the vicinity of the gage. The floor of the gage house was surveyed to be at
stage 7.83. It is estimated that the
instruments will be flooded and transmission will be lost at approximately stage 10. The structure to the northwest of the gage had its
foundation surveyed at approximately stage 17.2. Road
over topping does not occur on Highway 119 until approximately stage 22. Based on several spot elevations of the water
surface, the estimated channel energy slope is 1.5 percent.
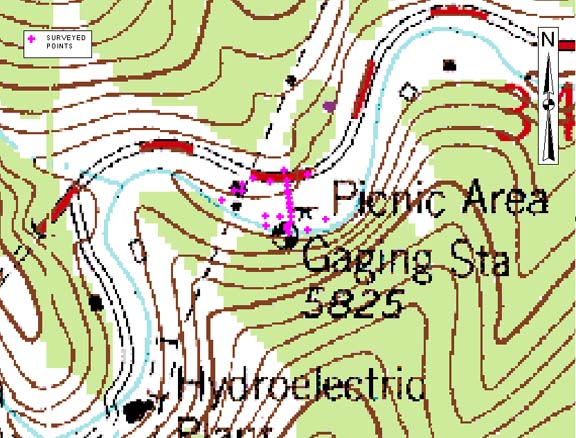
Figure
– 2 Surveyed Points
Site
photographs
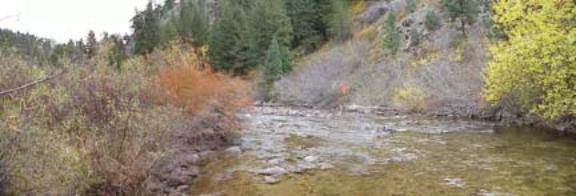
Several
digital photographs were taken of the site and several panorama views were created based
on the site photographs. Figure 3 shows
Boulder Creek at the gage location looking downstream.
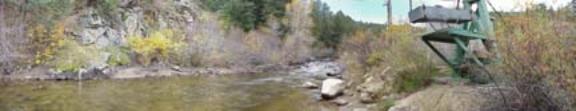
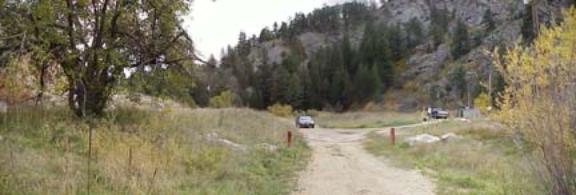
Figure 4 shows Boulder Creek at the gage location looking upstream. Figure 5 shows and the left overbank including
Highway 119 where the ground elevations were surveyed.
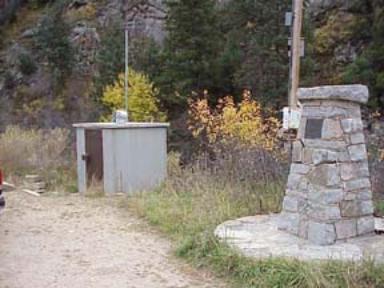
Figure 6 shows the gage house where the stilling well and transmitters are located.